How long does RNA-Seq analysis take in Trovomics?
I analyzed a RNA-Seq data set using Trovomics and within 47 minutes, I was ready to customize my visualizations! Keep reading to see the timed breakdown of the pipeline.

When was the last time you had RNA-Seq data analyzed? What was the turnaround time? If your answer was over 48 hours, using Trovomics could streamline your analysis and help you take back hours of your day. Whether you are pretty handy in building an RNA-Seq workflow or outsource your data to a bioinformatics core, time is always of the essence.
If you are doing your own analysis…It takes time to prepare the data. It takes time to process the files. It takes time to analyze, and even more to reanalyze. Once you’re done, you still need to visualize the data. Not to mention the time it takes to learn how to perform all these steps accurately and reliably. If you are outsourcing your bioinformatics…It takes time to receive the results. Depending on the backlog of your bioinformatics core or other service, wait times can take upwards of several months. Researchers already manage diverse responsibilities, which may include conducting experiments, literature research, writing, cell culture, animal husbandry, and more. In the current academic publishing landscape that rewards publishing first and fast, waiting several months may not be an option.
Trovomics opens access to bioinformatics that is not only high-quality, but fast as well. In this blog post, we’re going to put Trovomics to the test to see just how fast it can take you from raw data to data visualization.
The Trovomics Pipeline
Upstream Processing is the longest step in the Trovomics’ pipeline and other RNA-Seq pipelines. Our upstream processing consists of three major steps: trim, align, and quantify. We use the packages AdapterRemoval, HISAT2, and HTSeq, alongside our automations, to perform these steps, respectively. Each step is done on a sample level and will usually take >30 minutes per sample. In some cases, up to 1-2 hours per sample, depending on the original file size and how many processing units you have on your computer.
Downstream Analysis is where our pipeline performs differential expression analysis and functional analysis on your samples using a combination of publicly available (DESeq2 and clusterProfiler) and proprietary packages. These steps are performed quickly, usually taking a few minutes.
The Data Set
The dataset we are using is made up of 24 sample files that were obtained from sequencing samples from 12 mice. Each mouse has 2 files associated with it, due to paired-end sequencing. Read lengths were 65 bp long with a read depth of 30 million single reads per sample (>60 million PE reads per sample). The total size of all files was 19.27 GB in compressed form (gzip). Here is the breakdown of the files below:
| Sample Name | File Name | File Size (gzip, compressed) |
|---|---|---|
| NP-ANG1 | NP-ANG1_S16_L001_R1_001.fastq.gz | 794.8 MB |
| NP-ANG1_S16_L001_R2_001.fastq.gz | 811.9 MB | |
| NP-ANG2 | NP-ANG2_S17_L001_R1_001.fastq.gz | 738.5 MB |
| NP-ANG2_S17_L001_R2_001.fastq.gz | 753.4 MB | |
| NP-ANG3 | NP-ANG3_S18_L001_R1_001.fastq.gz | 635 MB |
| NP-ANG3_S18_L001_R2_001.fastq.gz | 649.3 MB | |
| NP+ANG1 | NPplusANG1_S22_L001_R1_001.fastq.gz | 856.8 MB |
| NPplusANG1_S22_L001_R2_001.fastq.gz | 876.3 MB | |
| NP+ANG2 | NPplusANG2_S23_L001_R1_001.fastq.gz | 834.8 MB |
| NPplusANG2_S23_L001_R2_001.fastq.gz | 851.5 MB | |
| NP+ANG3 | NPplusANG3_S24_L001_R1_001.fastq.gz | 854.8 MB |
| NPplusANG3_S24_L001_R2_001.fastq.gz | 873.6 MB | |
| PP-ANG1 | PP-ANG1_S19_L001_R1_001.fastq.gz | 808.5 MB |
| PP-ANG1_S19_L001_R2_001.fastq.gz | 825.2 MB | |
| PP-ANG2 | PP-ANG2_S20_L001_R1_001.fastq.gz | 888.9 MB |
| PP-ANG2_S20_L001_R2_001.fastq.gz | 909.6 MB | |
| PP-ANG3 | PP-ANG3_S21_L001_R1_001.fastq.gz | 772.2 MB |
| PP-ANG3_S21_L001_R2_001.fastq.gz | 788.6 MB | |
| PP+ANG1 | PPplusANG1_S25_L001_R1_001.fastq.gz | 803.1 MB |
| PPplusANG1_S25_L001_R2_001.fastq.gz | 822.3 MB | |
| PP+ANG2 | PPplusANG2_S26_L001_R1_001.fastq.gz | 793.3 MB |
| PPplusANG2_S26_L001_R2_001.fastq.gz | 813.8 MB | |
| PP+ANG3 | PPplusANG3_S27_L001_R1_001.fastq.gz | 748.3 MB |
| PPplusANG3_S27_L001_R2_001.fastq.gz | 765.7 MB | |
| TOTAL SIZE | 19.27 GB |
So now that we have our dataset ready to go, let’s put Trovomics to the test!
TIP: The size of your dataset will impact how long your analysis will take, regardless of whether you are using R or Trovomics. The size of your dataset will be influenced by the total number of files and the file size of each sample.
“A fastq.gz of ~1GB is normal. I’d say ~800MB is the smallest, for organisms like human or mouse. Big fastq.gz sizes would be > 2.5 or 3GB and these are the ones that were sequenced deeper.”
Timing Trovomics RNA-Seq Analysis
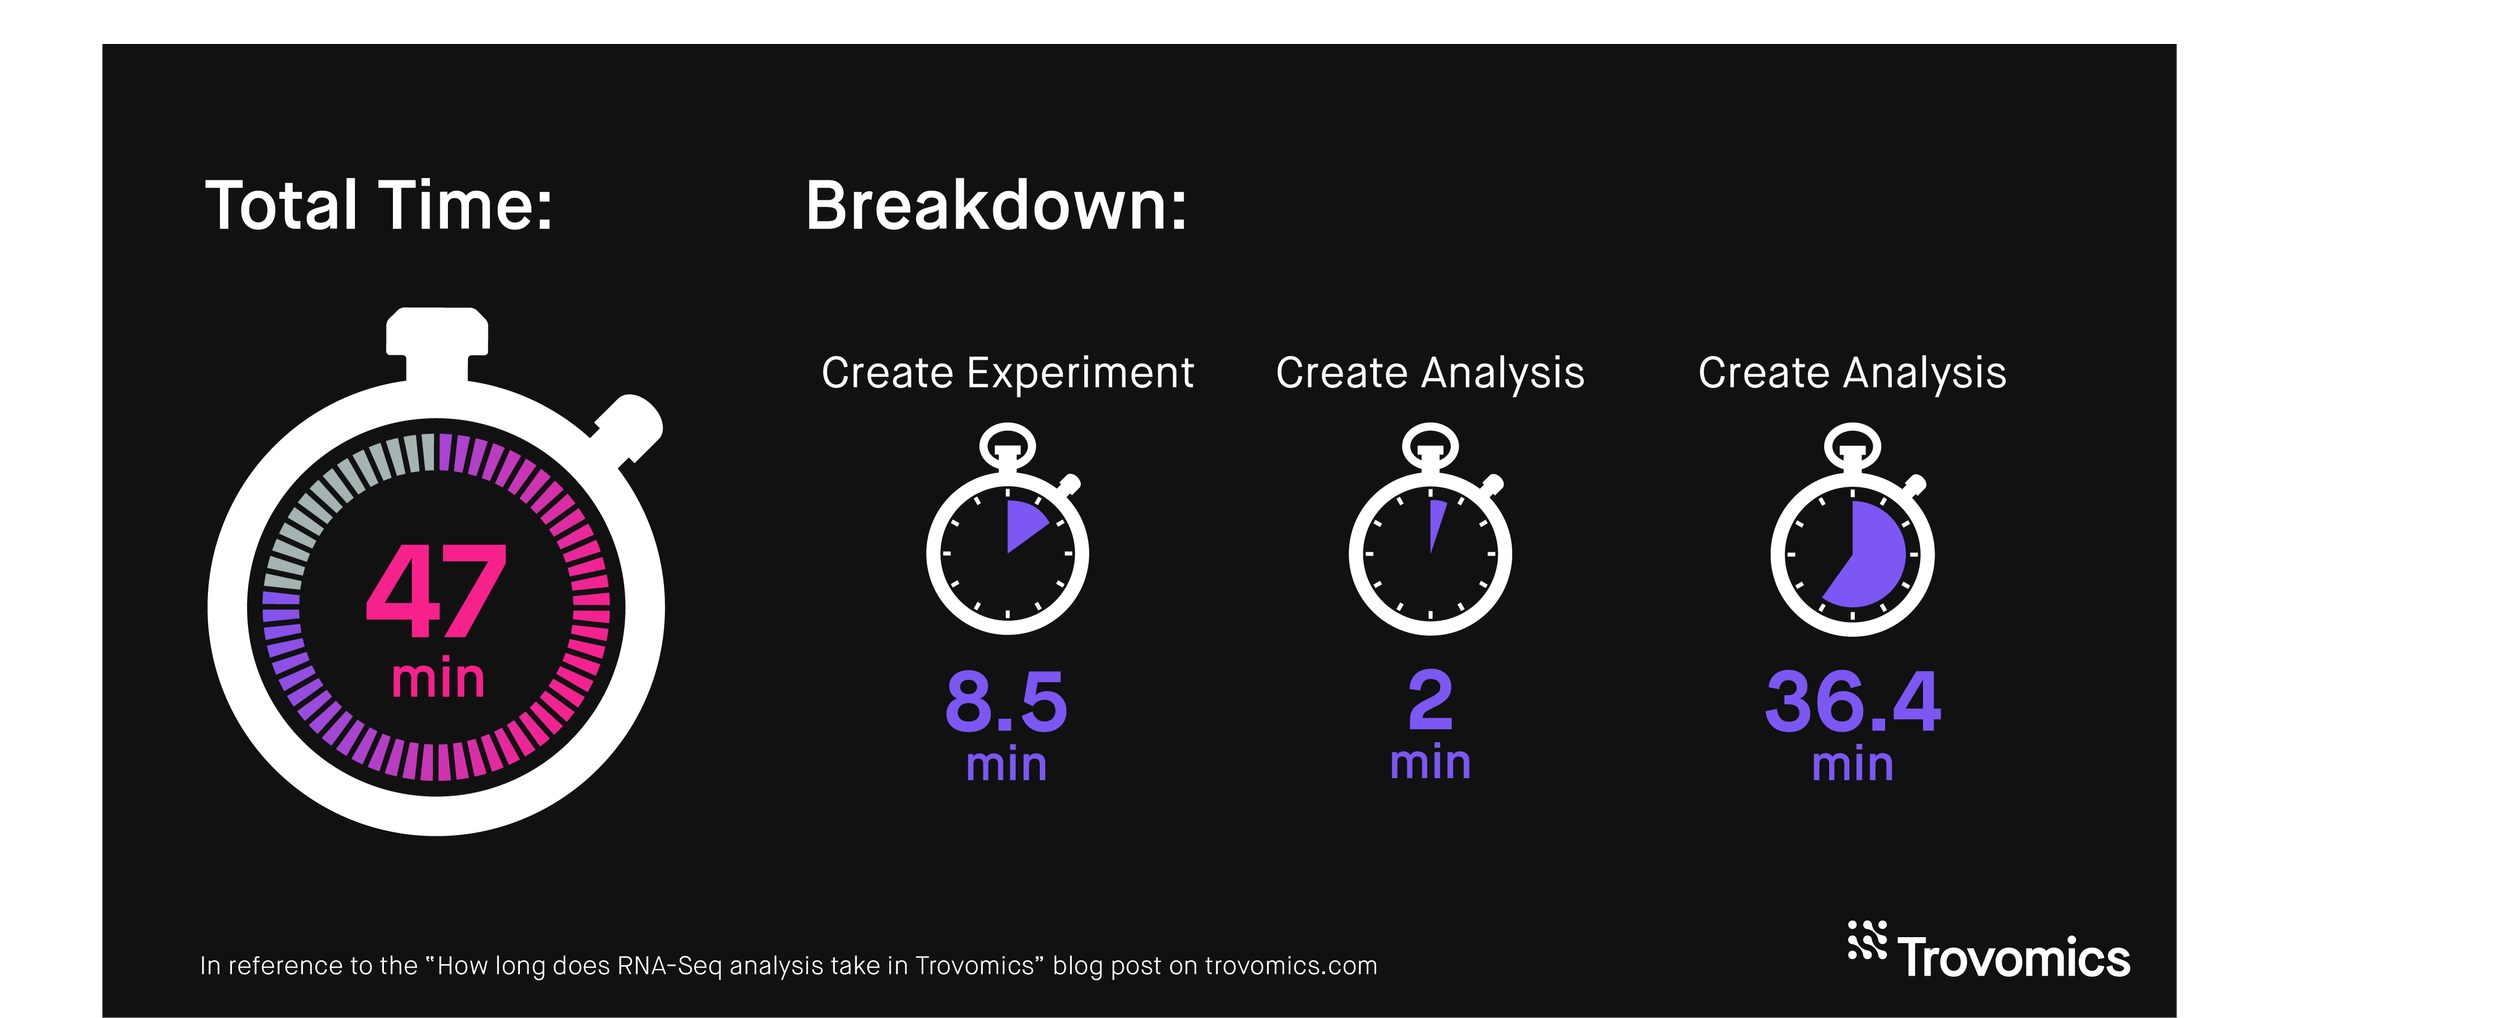
Create Experiment: 8 minutes and 34 seconds
Since I already knew the details of how my sequencing was done, entering experiment and sequencing details was quick. I already had my metadata table prepared. Uploading files is what took the most time in this step, taking 8 minutes for all 24 files. Not bad though!
Create Analysis: 2 minutes
I included all 12 samples in the analysis. I selected two variables for comparison: Condition and Treatment. I was interested in comparing the control group to my stressor, or to ANG 1 treatment. I left all the parameters on their default setting. Once I click “Run analysis”, my samples with my analysis settings are sent to the pipeline!
Analysis Run Time: 36 minutes and 24 seconds
This is when the samples actually get processed through the pipeline. Upstream processing took 30 minutes and 47 seconds and downstream analysis took 5 minutes and 37 seconds.
TOTAL TIME: 46 minutes and 58 seconds
It took about 47 minutes to go from FASTQ files to data that’s ready to be visualized, thanks to Trovomics’ automated process. Once you get access to the visualizer, you can begin exploring your data! If you already have genes of interest in mind, visualization can be quicker. If you want to focus on discovery, visualization can take as long as you need!
How does this stack up to your current RNA-Seq analysis workflow?